
Report
A data-driven report on data centers: tables across pages, charts, and a tabloid world map.
What it shows
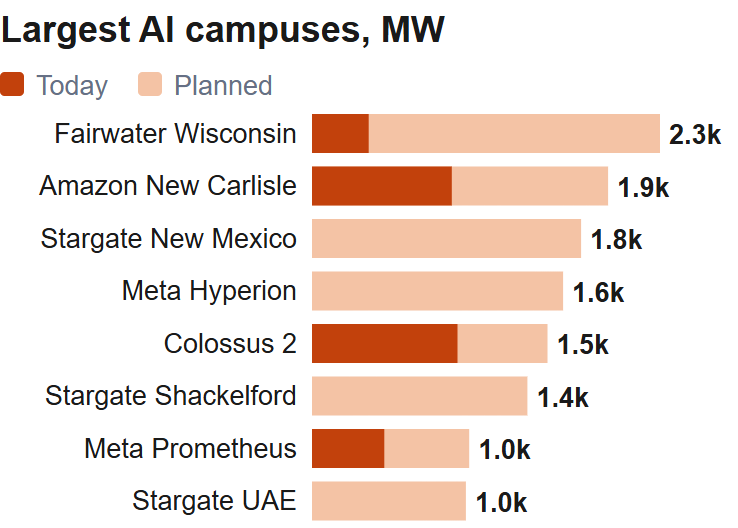
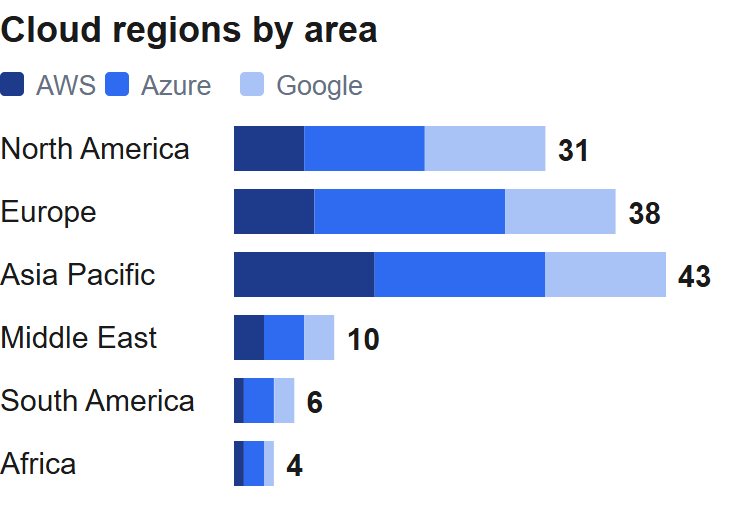
Section titled “What it shows”A report on where the world's data centers are, in two kinds: the cloud regions of Amazon,Microsoft and Google, and the AI campuses built since 2024. The figures, the tables and thesentences about them come from document.json, as in the invoice. What this adds:
pagination nothing here says where a page ends. Content flows, a row or an image moves to the next page whole, and the table header repeats at the top of each page images declare them in <assets>, place them with <img>. Their size is yours to set region text pinned to the top or bottom of every page, outside the flow. The one written first is the header, the one written last is the footer page scope page="each", "first" or "2-last" says which pages a region or a canvas layer is on. {page} and {pages} become the page number and the page count, counted within a section: a report that numbers its pages is one section sections each section sets its own page. The last one here is tabloid, landscape, and holds only a canvas: a world map drawn as paths, with a marker for each site paginate paginate="no" on a box keeps it whole: a heading stack moves to the next page with its paragraph instead of stranding the heading. It is set on each section of text here, and the tables are left to split, their header repeating
The prose is written for this data. Change the data and the sentences stay as they are, butcheck where the pages break when the content changes. The map is generated from the samedata: its land outlines are Natural Earth and its markers sit at town or metro level, so donot edit it by hand.Fonts and images
Section titled “Fonts and images”The document names 2 files, which go in an assets folder next to it. In Visual Studio Code, Lpdf: New Document puts them there.
The document
Section titled “The document”The document is 842 lines, so it is not repeated here. Download it above to read it beside the PDF it makes.